I used iNat data to look for trends in reptile observations in Arizona and I’m hoping someone else can look at this and let me know if this makes sense…
From 2018 to the present most species had more and more observations as iNat has added new users. To correct for this I divided the number of observations of each species in each year by the total number of reptile observations for that year. I also “normalized” the proportion of reptile species observations to total animal observations as another check.
I expected that maybe the most common species would become more common, and rarer species would become less common. But while some uncommon species did become less common, there was no consistent trend based on commonality.
AZ Reptile observations, from most- to least-observed:
This shows a mix of species becoming more and less common that doesn’t seem to be consistent from most- to least-observed species. Interestingly, several species of conservation concern became less common from 2018-2025: gila monster, sonoran desert tortoise, and black-tailed rattlesnake. Also, weirdly, Mediterranean house gecko became less common.
A confounding issue is that all users are not randomly finding reptiles. Some, and I have no idea what proportion, will be after a particular species and will ignore other ones. I do it with plants all the time. I am looking for “something interesting” and will ignore common things. I already have plotted enough of them!
Thanks for sharing this, Conor. I’m curious — what is your goal with this analysis? Are you trying to study reptile abundance, or are you trying to study observer behaviour?
Declines with Gila Monster, at the least, seem legitimate, given that is a species people would be looking for year after year. I’d want to compare that with other data from other studies though to see if it makes sense.
Declines with Mediterranean Gecko might indicate them reaching a stable state in the local ecosystem? A lot of invasive species come in and overwhelm the local system at first before finding a new stable state.
The same pattern can also go the other way: I’ve seen many individual users who will try to document every fence lizard or side-blotched lizard they see (in California, not Arizona).
Anyways, this is an interesting early exploration of the info, but I echo AdamWargon’s question:
I don’t mean this in an accusatory way (which I don’t think Adam meant either)–just a note that answers to questions like the OP’s wondering if the analysis makes sense depend heavily on the exact aim. For example, I start wondering how those changes might relate to weather patterns (especially rainfall), but I don’t kow if that would actually be relevant?
@adamwargon - Yes; both! Ultimately I’m interested in using citizen science data to estimate species abundance, but observation counts on iNat result from a complex mix of observer behavior and species abundance. The key is whether they can be distinguished…
@ruth-palsson, I also photograph uncommon species more often. I think this Observer Behavior could skew the results for species with few total observations, so I only included results for species with more than 1,000 observations.
@jmillsand, I also sometimes get obsessed with a common species and take a large number of photographs… There are a couple ways to see whether this impacts the results. For the species that increased the most (e.g. Western Side-blotched Lizard, Sonoran Gopher Snake, Long-nosed Snake) I looked at the top observers to see if one person had added an inordinate number of observations - but I didn’t see that.
Also, if someone took lots of photos of a single reptile species, this would impact the total number of reptile observations more than the total number of all animal observations. In the table, I “normalized” the proportion of each reptile species to both total reptiles and total animal observations. The results look pretty consistent either way. I also normalized the proportion of each reptile species to other iconic taxa and found similar results.
So I’m basically looking for other potential sources of Observer Bias or I think I have to conclude that these are real population trends.
Excellent checks/considerations… My brain is now starting to run in a few directions trying to find commonalities among the species with more obvious declines and increases.
Can’t say I’m coming up with too much though, and what I am thinking about would require somewhat more complicated statistical approaches (e.g., accounting for differences in spatial coverage each year or time of day of the observations). I honestly don’t expect that the results would meaningfully change though, given how much the species with different trends overlap in many of their traits (e.g., habitat, active periods).
However, the normalization you used may provide a clue… as the number of new users and observations tended to increase year-on-year, I would expect a growing proportion of records to be more incidental (e.g., “oh look, a lizard–let me get a pic!’) vs. intentional (e.g., “I feel like going roadcruising in the desert tonight”). My intuition says that as observations bias more towards incidental reports, species that are both common and more noticable (in California, side-blotched lizards easily fall into that category–I assume it’s similar in Arizona) will start to receive disproportionately more observations and species less likely to be stumbled across by accident (e.g., desert tortoise) will get disproportionally fewer observations somewhat regardless of actual population trends. This isn’t to say that there aren’t population trends to be noticed here (I would have expected the house geckos to be more likely to be casually observed, for example), just that there may be multiple processes behind the observed patterns.
As a side note, I wonder whether the gopher snake results are biased a bit since both the species, “gopher snake”, and a subspecies, “Sonoran gopher snake”, were included separately? Given their percentages, I wonder if identifiers have simply become more likely to ID things to the subpsecies level.
Fascinating comparison though, thanks for sharing!
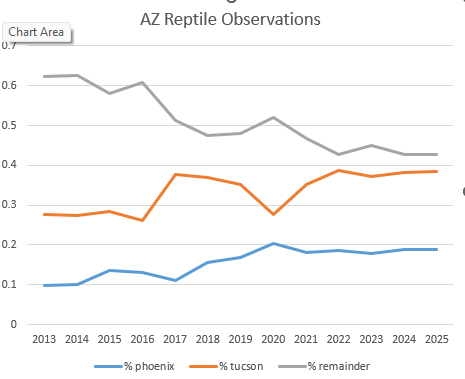
Thank you! I think we’re thinking on the same track. Most iNat observations are from developed areas, and developed areas are also an increasing proportion of total observations.
So these results are most representative of cities, not the countryside. It would make sense that the trends are most likely showing some combination of species that are easiest to observe in cities / species that tend to do well in cities.
I updated my analysis using only species to avoid potential subspecies identifier bias, and added 2025 data.