The City Nature Challenge (CNC) each April is a tremendous success in that it brings in new observers and new observations. However, there is a data distortion that I’ve been exploring recently. Namely, I was noticing the seasonality charts for species can show a marked spike in observations in April that may or may not be real in terms of activity or abundance of organisms.
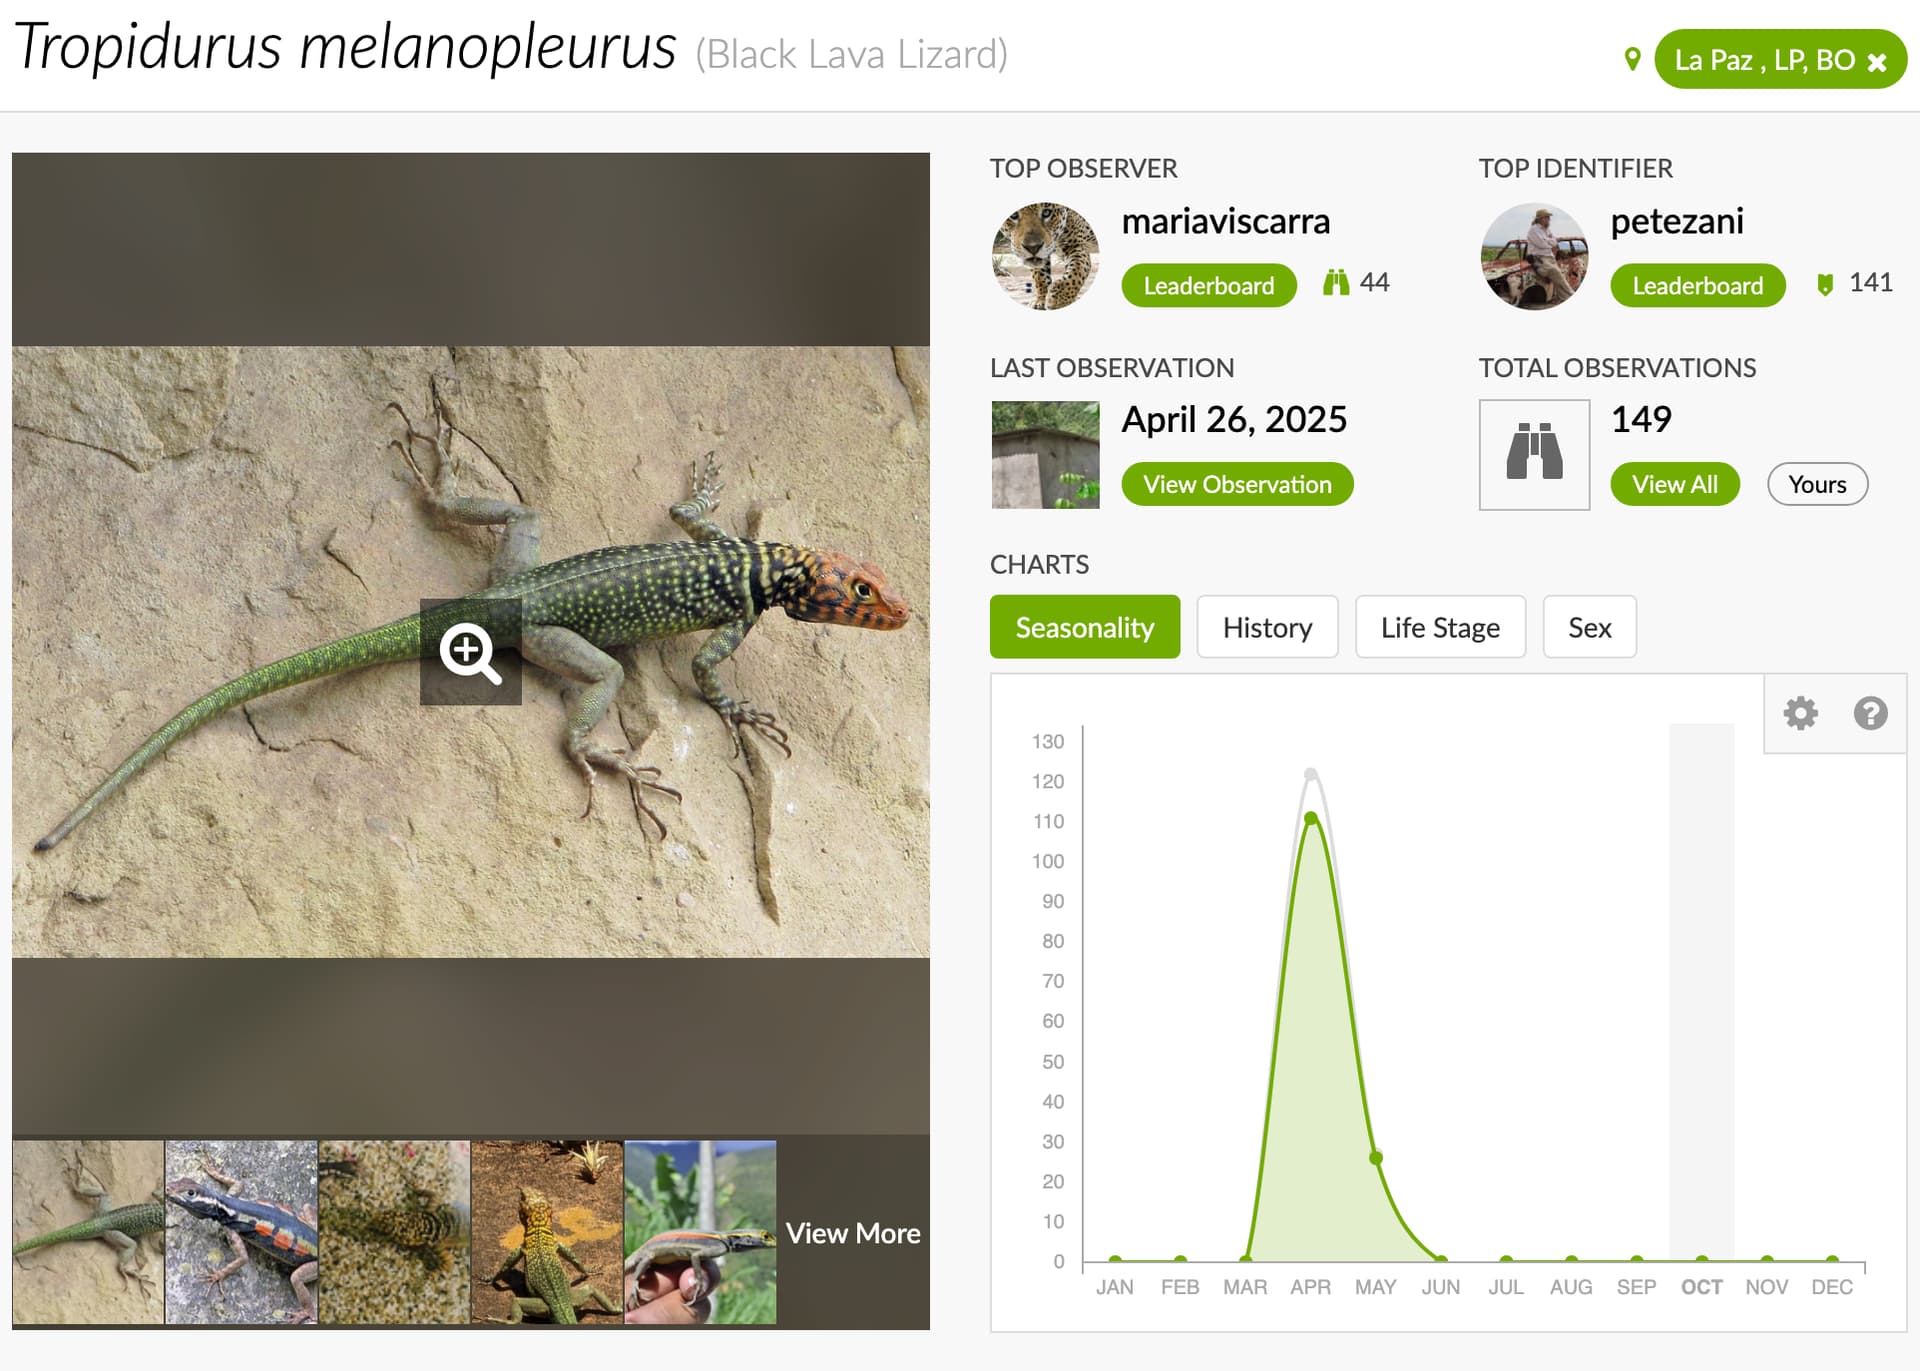
Observations of species near La Paz, Bolivia, are a great example here because La Paz is annually near the top of the leaderboard in CNC observations. The examples I use here are lizard examples mostly because April is fall in the southern hemisphere and so observations don’t correspond to the spring increase in activity of lizards, which probably happens in September or October. These species only have a couple hundred observations, which also helps make the distortion more obvious. In both examples below, observations in the La Paz region outside the CNC are fairly low to non-existent.

I also removed the location filter for the second species to show what its overall seasonality plot looks like. Similar distortion, but with more observations outside the timing of the CNC. If it weren’t for the CNC distortion, the seasonality peak would likely occur during local spring season (i.e. October).

These are extreme examples to make the point that if one has a large urban area or large population of observers contributing CNC observations, there is likely some seasonal distortion to those local data that one should be aware of. Going forward, when considering seasonality plots, I will probably be filtering out any data from the CNC dates in order to minimize this data distortion.