I got to thinking after viewing https://www.inaturalist.org/stats and seeing over 400 000 active users in the last couple of weeks. Really amazing that so many people are using the platform. I think the available stats is a part of what makes iNat so fun for me. So as someone who is interested in the stats that the site offers, I got to thinking, is there a way to see other details in how people generally use the site? As some examples: How many (or what percentage) of iNat’s users have say 100, 1000, or 10 000 observations or IDs? How long does the average user remain actively using iNat? Do most users upload 5 observations in a week and decide they don’t like the app, or do they stick to it and keep using it? I’m mostly just curious, and it’s interesting to think about where you personally might fit in. Maybe being able to see this would introduce another aspect of gamification which seems to have its own + and - aspects after reading some other forum posts on that. But I think it would be an interesting thing to be able to sort of characterize and see just how people are contributing to the platform overall.
It could be interesting if created and interpreted carefully (weeding out bad numbers, weighing potential confounding variables etc.), however not sure if it would find any use beyond the sheer curiosity and dataviz exercise.
https://www.inaturalist.org/blog/100580-identification-pilot-to-onboard-new-users
this has run since October 2024.
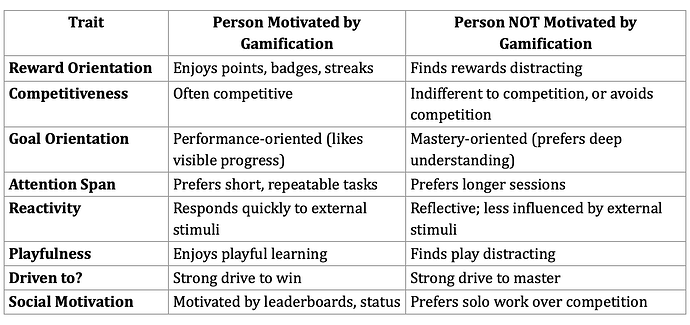
This (gamification) has been discussed at great length. Here is one more contribution to the discussion . . .
I suppose I gamify mostly against myself. I won’t ever have the numbers of observations and taxa that some inatters have acquired and that’s okay. But I do like observing something new and learning about it if I was ignorant of it previously.
I don’t think I’ve ever looked at that Stats page before, although I’m familiar with its Year in Review subpages. I think those, and the Personal Year in Review pages we can generate from them, are some of the most amazing, information-and-link-packed pages I’ve ever seen.
Looking at the Daily Users chart had me puzzled for a while. That shows the number of identifiers averaging around 25% of the number of observers, with a higher percentage during the winter months. But according to the Year in Review, 88% of people added only observations, last year. How could that be?
I suppose it’s because the same group of identifiers are performing that task, day after day, while the observations are intermittently being submitted by a much larger group.
I don’t think the original post was about gamification. It’s discussing general site stats, not the personal stats people often look at.
Also this research article about iNat
