Description of need:
As an Inat user I would like to see the different grades of observations with different colors on the taxon maps
so that I can focus on the identification of observations that fall outside the presumed range
so that I can see if there are research grade observations in a particular area
Feature request details:
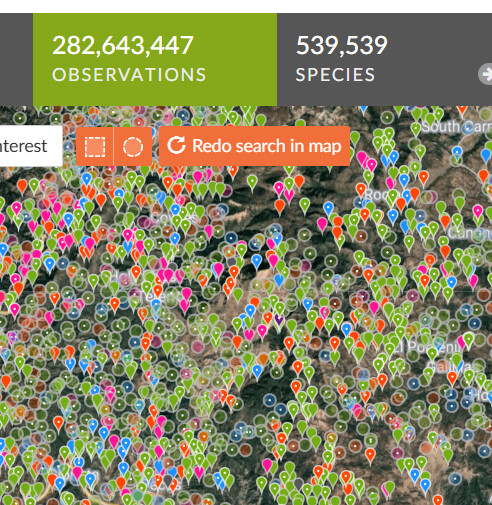
Currently color coding marks domains of life, i.e. vertebrates (blue), invertebrates( red), plants (green) etc.
On taxon pages therefore all observations have the same color.
Honestly I would ditch the color coding for domains of life, and I would instead use different icon shapes like leaves, mushroom, animal etc..
There should be color coding separating the Research Grade Observations from Non-Research Grade Observations on the Taxon Pages at least. This would add extra information for users to see the presumed range.
For identifiers this could add extra help to identify non-research grade observations on the edges of the range, or outside the presumed range to focus on identification of these outliers.
You can already view casual observations in a different color on taxon pages by clicking the overlay button at the top right of the taxon page map and selecting the box for ‘Captive/Cultivated’. This also works on the map on individual observations.
Research-grade observations are currently separated from verifiable observations on the map by having a dot in them, but I agree that having them be a different color entirely would be helpful, especially when the map is zoomed out and they just become little red squares.
It would also be great if the overlay function were available on the identify page maps, so that one could choose to toggle on or off nearby casual-grade observations.
I support this for RG vs not RG, it would be really useful to see these separately even when zoomed out, but I don’t think casual obs should show up by default
For a square that has both RG and non RG the color code should be for RG
That’s an interesting idea, but with colour already ‘encoding’ information about the organism I think it might be confuse to also add metadata about the observation in it. Maybe texture, shape or opacity could work better to differentiate between various quality grades?(:
Why would you need it on the taxon page? The taxon pages only maps are restricted by taxonomy, so everything they show would necessarily be the same domain of life and therefore the same color. Perhaps I am misunderstanding?