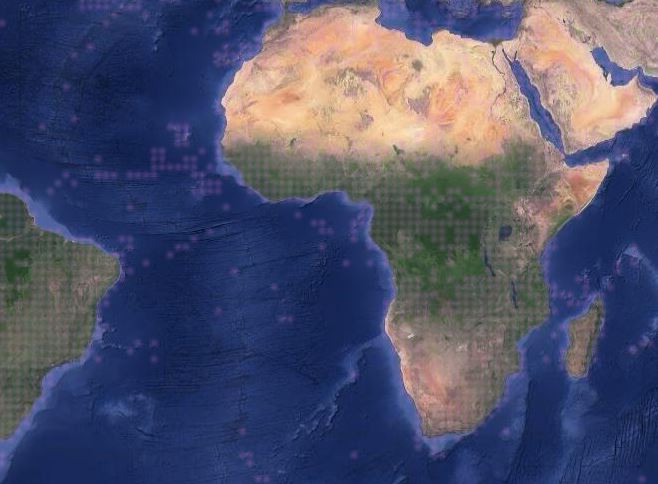
It is playing up again for me at all scales! Perhaps it is my slow internet speed? Captureinat3|658x484

no, it looks like they’re working on a new and improved version of the heatmap tiles. if you opt out of the map tile test, you should be able to get the original heatmap tiles on that map (though you will also get the original circles on all the other maps).
1 Like
I love that this reduces the server load and it’s clearly useful for conveying occurrence frequency. It does make it very tricky to find a single observation, though. Maybe there could be something done with color to call that out? To test, I went to a place where I knew I didn’t have many observations, and it was very difficult to find.


6 Likes
Did you perhaps change a setting on the map refresh rate or something? Over the last week the site has gone very slow, apparently due to the maps refreshing.
Subscribing to this test has greatly speeded up this site (esp. on the Identify and Identotron pages), which in the last week has become unbearably slow to use on the old maps.
It might be something totally unrelated, but I came here to complain about the speed, when I encountered this “improvement”, which it definitely is compared to the last week, but I am not certain to before that (in terms of page download speed).
I zoom in a lot on the maps (we work fine-scale here in the Cape Flora), and I do notice that the old symbols just “spaced out” as one zoomed in, but now the grid cells keep on refining to finer and finer cells as one zooms in. For a species with say 200 records over 800km, how much is saved by instead of just loading 200 points and zooming, by having to reassign cells finer and finer as one zooms in?
(or is “one-solution-fits-all” necessary the best option? - - I have no clue whatsoever: just eternally curious)
4 Likes
A thought regarding the problem with low-observation-count tiles being hard to see, or difficulty seeing due to overlaying like colors on the map, etc- maybe solid margins on the tiles would help? That would still allow the variable transparency by frequency to be visible.
4 Likes
Pisum also suggested this and did a mock-up (see final image here: https://forum.inaturalist.org/t/open-test-of-map-tile-improvements/7833/21 ). I think it’s definitely worth considering as a solution.
I know this has been raised, but I will provide feedback from the perspective of a colour blind user. Many of these are effectively unusable for me, I can’t make out any indicators at all on many of the views. As others have said, something needs to be done to make the markers pop out more visually.
10 Likes
having used this for this whole time i wanted to pop back in though maybe just to reiterate what others are saying.
I like it, a lot, and prefer it to the old settings, but please make the low-observation tiles darker. And since the zoomed out level doesn’t color things by taxa anyway, i like the idea someone else had of making them all purple. A color that is barely ever on maps or air photos. I think that would be a lot easier to see. Red could work too. Green for plants is a pain. I imagine blue for fishes is also a pain for similar reasons…
9 Likes
This is probably a repeat of what someone else has said, but I feel like if it was heatmapped in a similar way to the eBird hotspot map it should work pretty well. The reds and yellows are very easy to see in most areas:
https://ebird.org/hotspots
1 Like
i think the most interesting thing about this particular eBird map is that it shows species density / diversity (as opposed to observation density). (i’m still not a fan of color gradients for the proposed observation density squares in iNat though. it looks like they are working on a new version of the regular heatmap that may provide the color gradients for color gradient fans though.)
I only just saw this and so I have opted in to the test tiles.
Overall, I like these very much and it’s encouraging to know that they’re reducing server load. But I would echo what others have said about visibility. As @charlie mentioned above:
please make the low-observation tiles darker
This is a big problem when looking at plant distributions where iNat is also shading the background country/state/county based on atlas or checklist info.
And since the zoomed out level doesn’t color things by taxa anyway, i like the idea someone else had of making them all purple.
Yes. Something that contrast well for those of us with “normal” vision and hopefully for those with common color-blindness variants.
I think various shades of the same color is likely to be better than a “heat map” approach. My personal preference would be that eventually iNat can map multiple taxa, each with its own color. (I understand that’s a long way from happening, but I’d rather that we don’t foreclose that by developing a lot of multi-color map interfaces now.)
4 Likes
I hope we will get maps for colour blind too, so purple is our choice.
8 Likes
Perhaps it would be worth surveying how many iNatters deal with colourblind issues - and offering them an accessible version? Or offering an accessible version anyway - as websites should.
8 Likes
There will be a reasonable number. 7-8% of men of European descent have some form of red/green colourblindness (which is the commonest form). In the US approx 10.5 million men don’t have normal red/green vision.
Trying to find iNatters with colourblind issues to help test the new maps is probably a good plan.
4 Likes
Just to be clear, colour blindness is not a single spectrum. about 2/3rd’s of those with it have red/green issues, but up to 1/3rd have other variants, including myself, with a very small percent having totally monochromatic vision.
You cant design a colour palette to address everyone, that’s why size and structure are more important in the markers.
7 Likes
But still many websites have two options for colors, I don’t think it would be too hard to do.
3 Likes
They do, and they are generally set up to address the 2/3rds of colour blind individuals who have the most common form. If the idea is to make it usable to all colour blind users, that serves no purpose. Making an option to deal with red/blue colourblindess does nothing for someone like me who has blue/yellow.
5 Likes
Sorry, I didn’t meant to imply that it’s the only type of colourblindness.
Yes, that’s what I’ve read previously. I play board games, which often use colours to convey information. There are a significant number of games that haven’t taken colourblindness into consideration (though I think it is getting better).
Am I right in saying that a colour palette with where each colour is a different shade when converted to greyscale will work? Obviously that limits the number of colours that can be used somewhat.
3 Likes
Even for those of us who have supposedly normal color vision, I often find color coding difficult to tell apart when there are two similar shades. Don’t know if that’s a common thing or related to my own vision (is there a more subtle form of color blindness?). I would welcome a color coding system that color blind folks can use … I think it would help many of the rest of us also.
4 Likes
The map tiles has not been implemented for maps “Map of Observations” on collection projects. Is there a specific reason for this?
2 Likes