I was doing my usual review of recent frog postings in my area and on one observation that was just audio someone commented saying it would’ve been useful to see a spectrogram to help with the ID. So I thought, “why not?!”
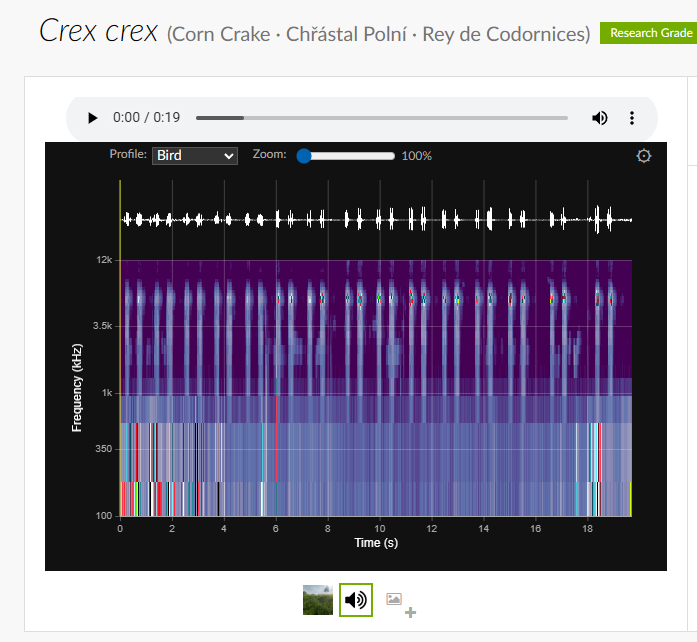
So I made iNatSpectro, a browser extension that adds a spectrogram for any audio files on an observation. It’s free, of course, and I’d love it if anyone has any feedback on how I could make it more useful.
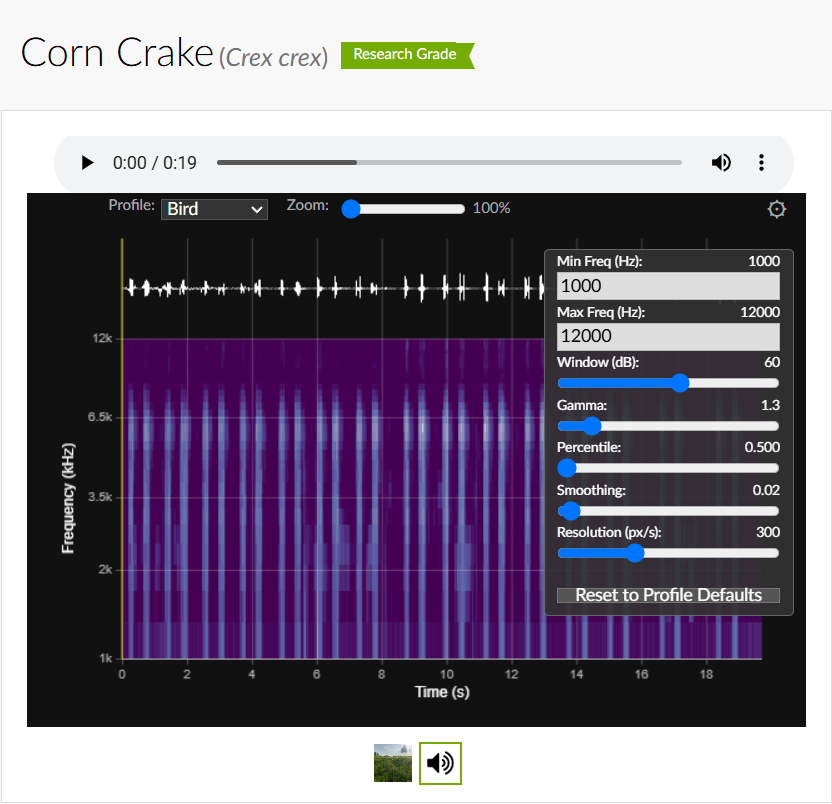
Clicking the little cog reveals a number of settings that can be adjusted also.
Feedback is welcome! If this is something the iNaturalist team would like to incorporate into the site itself, please consider it my gift to help get started!
(I’m still making my way through all the various postings on the forums about spectrograms on iNaturalist, but in the meantime, as a proof-of-concept (and if desired, a basis) for having them built into the website, there’s this.)
This is a fantastic tool! I often wish iNaturalist provided something like this. Thanks for your work.
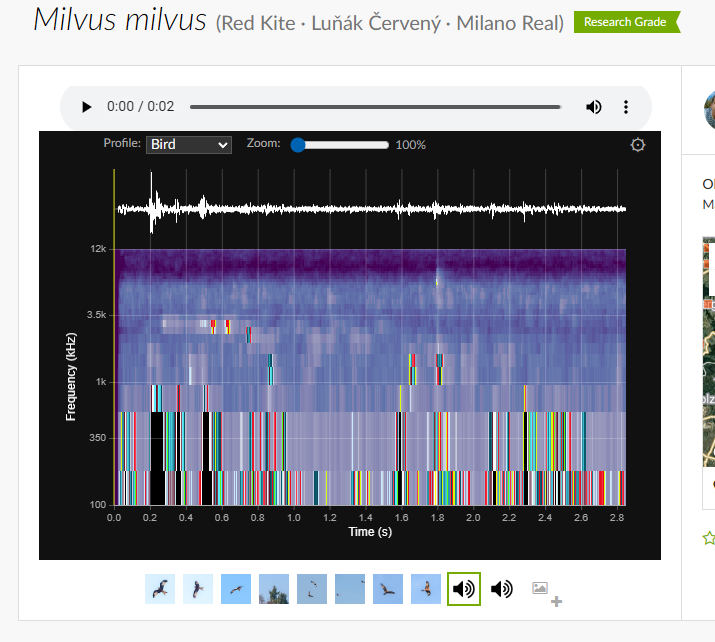
However, when I try it on my observations, the bottom part looks weird. The only thing I do when editing the sounds recorded by phone in WAV is I normalize the sound and maybe sometimes I do some denoising. I tried adjusting the parameters but it didn’t make much of a difference. My browser is the latest Vivaldi (Chromium based) on Windows.
Thank you, seems I didn’t tweak the parameters enough :-) It might indeed be because of the logarithmic scale. eBird seems to be using a linear one, this is the same corn crake observation (and files) I uploaded there: https://ebird.org/checklist/S247180263, I don’t know whether they apply the same gamma, smoothing, etc. parameters on every sound recording there.
My pleasure! I’ve done some testing with linear vs logarithmic and I definitely think the linear mode for birds makes things a lot clearer. I’ve submitted an update to the Chrome Store, so once it’s been reviewed, it should be available for you!
Ooh, naturalists are so talented and generous and wonderful!!! Thank you @japh :-)
Have tested on Brave (chromium-based) on Linux and it works well. I’m getting the same “test pattern” lines as @caroig . I messed about with the settings a bit but couldn’t improve it that much (any resolution above 350 nearly crashes my machine - this will be my machine and that fact that I have too many tabs open at all times despite trying to keep it tidy ;-)
This does not bother me overmuch coz I find the waveform easier to read than a spectrogram anyway. In fact, maybe it would be a nice option to choose to show one or both?
@japh Thanks for making the extension! For birds, I wonder if one could make the spectrogram more fine-grained. For example, for this American Robin observation, the produced spectrogram (with minimum frequency adjusted from 100Hz to 1000Hz):
The more-fined grained spectrogram would make the spectrograms more comparable to some well-known samples, e.g., those from Peterson Field Guide to Bird Sounds.
I tried tweaking the various provided settings. None of them seems to change how fine-grained the spectrogram is.
On linear vs logarithmic scale, I’m under the impression that the extension currently uses logarithmic scale.
For birds, my impression is that the common practice is to use logarithmic scale, e.g., the spectrograms in the well-known samples of Peterson Field Guide to Bird Sounds.
The typical minimum frequency is probably around 1000 Hz instead of 100 Hz (the default in the extension’s bird profile).
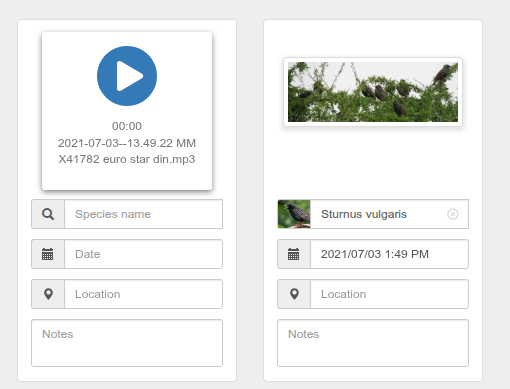
And the file name does not show (which it usually does). I need the file name because it shows the date:time & species, which I need to enter manually coz iNat can’t fetch it from the metadata (which seems to be stripped when I convert my videos to audio files in Audacity).
I don’t think it’s necessary to have it on the upload screen. What do others think?
But, Good News!, I have discovered that one can change the options on the extension from “On inaturalist.org” to “When you click this extension”. So I can turn it off when uploading.
I tested this on my bird and bat observations. It worked great on my bird observations. However, I was only able to get it to work on one of my bat observations. My bat recordings are slowed to 1/10th speed (which is a common convention so that they are within the human auditory range). It worked on this one: https://www.inaturalist.org/observations/66054745, but not these: https://www.inaturalist.org/observations/66055763, https://www.inaturalist.org/observations/66030666. For the later two, it only shows an empty purple field. Do I need to change the settings? Increase the volume of the recordings?
Thanks for building such a useful browser extension! I also hope you can release the source for it one day (even if it isn’t completely polished). Maybe it could even be integrated into the iNaturalist software.
Nevermind, it looks like I just needed to dramatically lower the frequency range, due to it being slowed down. It would be cool if it automatically detected the correct frequency range, but I imagine that’s easier said than done. Maybe you could create a “Bat 1/10th speed” profile.
Hi, great work! I have been advocating for a iNaturalist solution for spectorgrams ever since I saw the frequently uploaded screenshots of other apps. I do not use chrome so I could not test it. But one thing that is missing is documentation about the generation of the spectrum. For interpretation of Short Time Fourier Transformations, it is crucial to know the parameters, as different parameters create different looking spectrograms, especially when you want to optimize time vs frequency resolution. This can also lead to blocky looking images as @caroig observed. Because of the Rayleigh frequency limit, it could happen that low frequency signals are filtered out because of a short time window length. This could maybe be ignored for birds but could be bad for toads. So ideally you want to have control about these parameters too (hop size, window size/time frame). Maybe you can add this to the profile settings? Maybe there could be a profile setting for birds and for other species groups to make this easier for inexperienced users.
Are the Min and Max frequency from your profile settings a filter before the STFT is done or does it just cut the shown spectrogram?
I stand corrected - I took another look. Peterson Field Guide to Bird Sounds and Merlin Bird ID app both also use linear scale for for frequency / y-axis.