Well, seems that Portugal, were i live, is not a slacker.
4 Likes
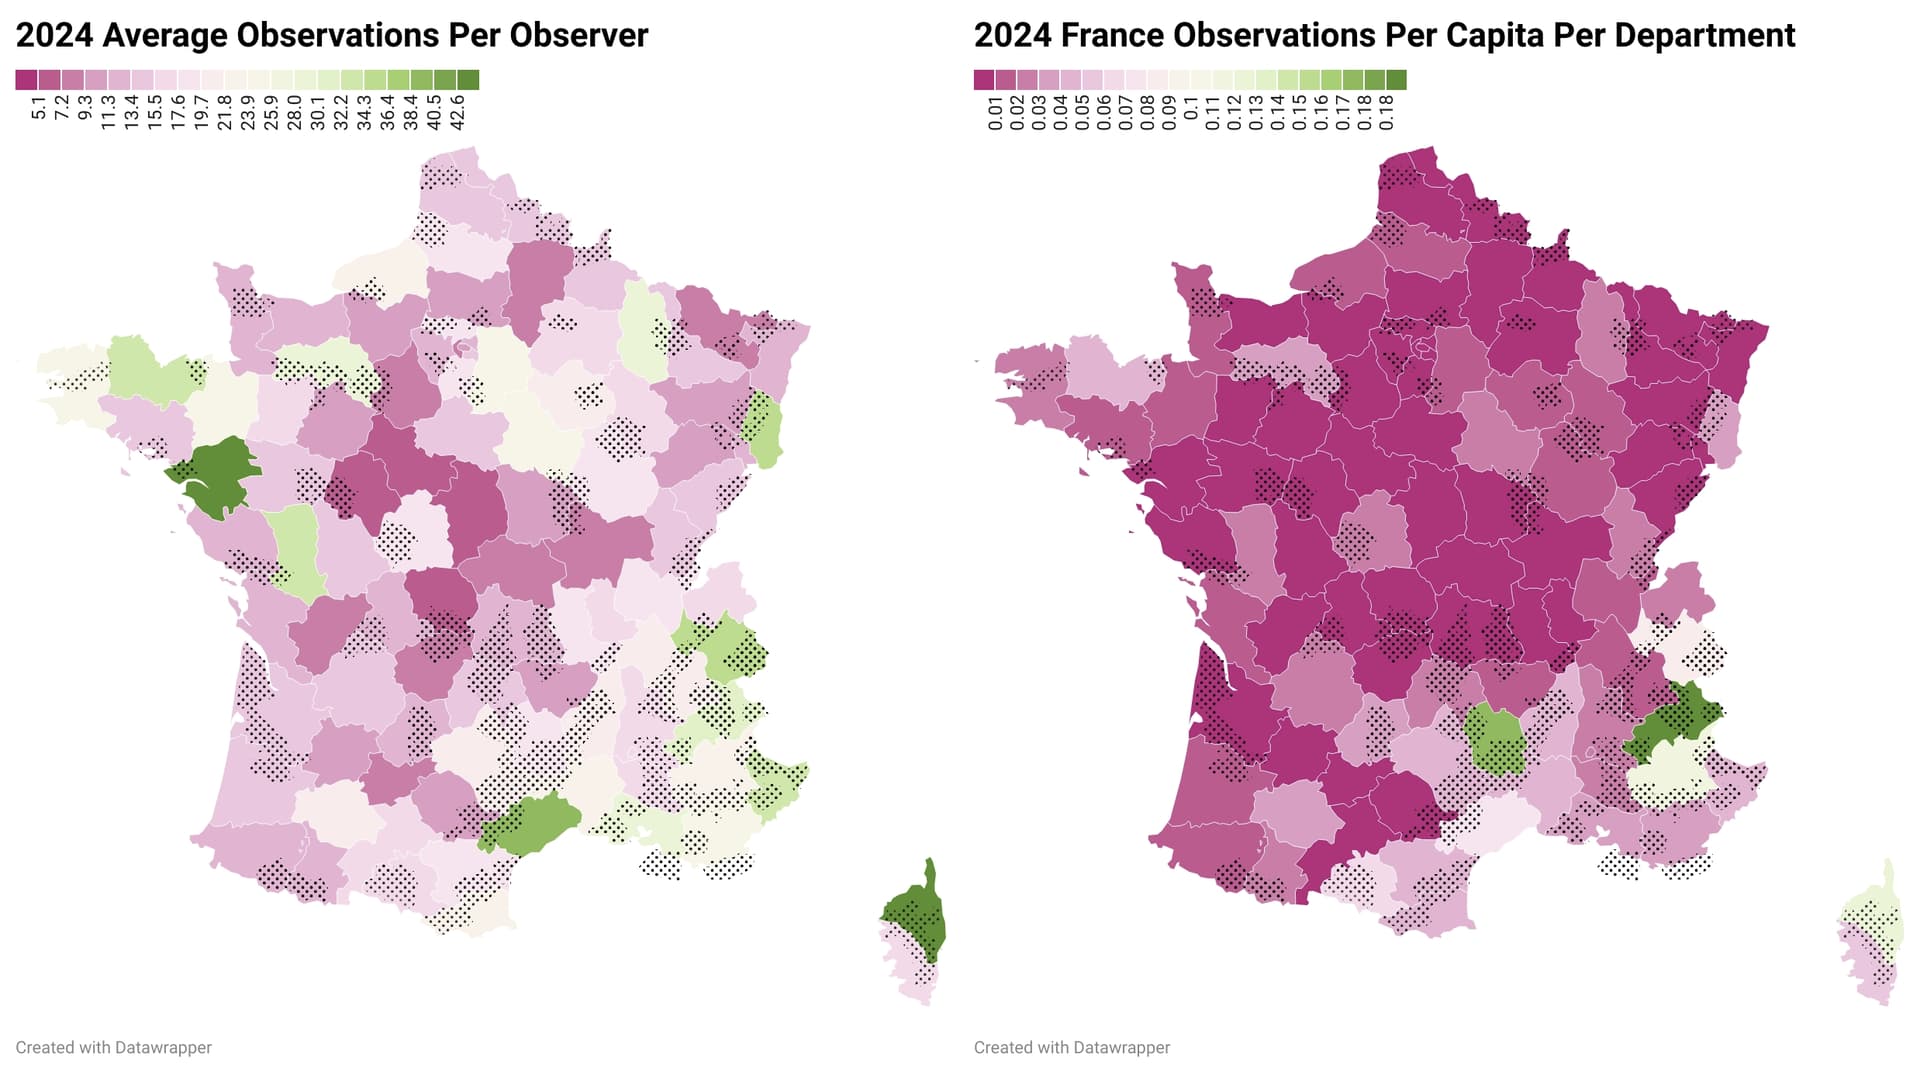
I got curious with the french map - so made average observation number per observers, and then overlaid the regional and national parks to see if there’s any correlation. There doesn’t seem to be any ![]()

Data
| Column 1 | Column 2 | Column 3 | Column 4 | E | F |
|---|---|---|---|---|---|
| Departments | Observations | Population | Observation Per Capita | Observers | Observation Per Observer |
| Ain | 13,389 | 679,498 | 0.0197 | 710 | 18.9 |
| Aisne | 1,465 | 521,632 | 0.0028 | 203 | 7.2 |
| Allier | 1,839 | 332,708 | 0.0055 | 250 | 7.4 |
| Alpes-de-Haute-Provence | 19,530 | 168,161 | 0.1161 | 834 | 23.4 |
| Alpes-Maritimes | 47,345 | 1,119,571 | 0.0423 | 1,413 | 33.5 |
| Ardennes | 2,574 | 265,737 | 0.0097 | 175 | 14.7 |
| Ardèche | 15,156 | 336,501 | 0.0450 | 753 | 20.1 |
| Ariège | 9,980 | 155,813 | 0.0641 | 569 | 17.5 |
| Aube | 4,516 | 312,730 | 0.0144 | 217 | 20.8 |
| Aude | 15,777 | 378,775 | 0.0417 | 888 | 17.8 |
| Aveyron | 12,123 | 279,470 | 0.0434 | 593 | 20.4 |
| Bas-Rhin | 8,995 | 1,170,551 | 0.0077 | 696 | 12.9 |
| Bouches-du-Rhône | 68,300 | 2,078,397 | 0.0329 | 2,357 | 29.0 |
| Calvados | 8,307 | 706,605 | 0.0118 | 665 | 12.5 |
| Cantal | 3,480 | 143,567 | 0.0242 | 258 | 13.5 |
| Charente | 2,815 | 349,856 | 0.0080 | 310 | 9.1 |
| Charente-Maritime | 11,758 | 674,439 | 0.0174 | 902 | 13.0 |
| Cher | 1,478 | 295,729 | 0.0050 | 207 | 7.1 |
| Corrèze | 2,913 | 238,962 | 0.0122 | 322 | 9.0 |
| Corse-du-Sud | 8,822 | 167,658 | 0.0526 | 531 | 16.6 |
| Creuse | 1,346 | 113,922 | 0.0118 | 192 | 7.0 |
| Côte-dOr | 9,639 | 537,752 | 0.0179 | 525 | 18.4 |
| Côtes-dArmor | 26,315 | 611,351 | 0.0430 | 791 | 33.3 |
| Deux-Sèvres | 9,591 | 373,682 | 0.0257 | 290 | 33.1 |
| Dordogne | 9,797 | 413,192 | 0.0237 | 714 | 13.7 |
| Doubs | 5,467 | 552,321 | 0.0099 | 368 | 14.9 |
| Drôme | 14,008 | 524,109 | 0.0267 | 879 | 15.9 |
| Essonne | 13,450 | 1,331,827 | 0.0101 | 732 | 18.4 |
| Eure | 4,766 | 598,339 | 0.0080 | 466 | 10.2 |
| Eure-et-Loir | 1,743 | 430,422 | 0.0040 | 212 | 8.2 |
| Finistère | 27,374 | 931,604 | 0.0294 | 1112 | 24.6 |
| Gard | 37,390 | 766,765 | 0.0488 | 1602 | 23.3 |
| Gers | 6,789 | 193,695 | 0.0350 | 340 | 20.0 |
| Gironde | 18,376 | 1,707,780 | 0.0108 | 1298 | 14.2 |
| Guadeloupe | 10,025 | 378,561 | 0.0265 | 303 | 33.1 |
| Guyane | 55,034 | 295,385 | 0.1863 | 378 | 145.6 |
| Haut-Rhin | 24,566 | 769,047 | 0.0319 | 716 | 34.3 |
| Haute-Corse | 23,414 | 187,870 | 0.1246 | 524 | 44.7 |
| Haute-Garonne | 17,741 | 1,487,804 | 0.0119 | 1,134 | 15.6 |
| Haute-Loire | 3,017 | 226,900 | 0.0133 | 294 | 10.3 |
| Haute-Marne | 3,074 | 168,200 | 0.0183 | 177 | 17.4 |
| Haute-Savoie | 21,652 | 866,490 | 0.0250 | 1273 | 17.0 |
| Haute-Saône | 1,613 | 232,523 | 0.0069 | 170 | 9.5 |
| Haute-Vienne | 3,669 | 370,339 | 0.0099 | 310 | 11.8 |
| Hautes-Alpes | 27,540 | 141,661 | 0.1944 | 900 | 30.6 |
| Hautes-Pyrénées | 7,221 | 232,534 | 0.0311 | 557 | 13.0 |
| Hauts-de-Seine | 5,270 | 1,651,407 | 0.0032 | 712 | 7.4 |
| Hérault | 93,371 | 1,243,225 | 0.0751 | 2410 | 38.7 |
| Ille-et-Vilaine | 22,230 | 1,127,720 | 0.0197 | 873 | 25.5 |
| Indre | 5,070 | 213,871 | 0.0237 | 269 | 18.8 |
| Indre-et-Loire | 3,057 | 616,751 | 0.0050 | 503 | 6.1 |
| Isère | 25,621 | 1,307,146 | 0.0196 | 1267 | 20.2 |
| Jura | 6,095 | 257,483 | 0.0237 | 395 | 15.4 |
| La Réunion | 8,861 | 885,700 | 0.0100 | 315 | 28.1 |
| Landes | 8,258 | 434,933 | 0.0190 | 602 | 13.7 |
| Loir-et-Cher | 2,539 | 326,941 | 0.0078 | 362 | 7.0 |
| Loire | 7,913 | 775,102 | 0.0102 | 413 | 19.2 |
| Loire-Atlantique | 12,247 | 1,503,876 | 0.0081 | 279 | 43.9 |
| Loiret | 5,585 | 689,581 | 0.0081 | 400 | 14.0 |
| Lot | 5,735 | 175,800 | 0.0326 | 496 | 11.6 |
| Lot-et-Garonne | 2,843 | 330,385 | 0.0086 | 289 | 9.8 |
| Lozère | 12,750 | 76,647 | 0.1663 | 660 | 19.3 |
| Maine-et-Loire | 7,880 | 834,135 | 0.0094 | 564 | 14.0 |
| Manche | 8,780 | 494,200 | 0.0178 | 674 | 13.0 |
| Marne | 5,152 | 562,874 | 0.0092 | 314 | 16.4 |
| Martinique | 6,119 | 349,925 | 0.0175 | 223 | 27.4 |
| Mayenne | 3,482 | 304,981 | 0.0114 | 223 | 15.6 |
| Mayotte | 930 | 320,901 | 0.0029 | 223 | 4.2 |
| Meurthe-et-Moselle | 4,544 | 730,320 | 0.0062 | 329 | 13.8 |
| Meuse | 5,196 | 178,562 | 0.0291 | 178 | 29.2 |
| Morbihan | 13,574 | 782,348 | 0.0174 | 964 | 14.1 |
| Moselle | 4,315 | 1,055,259 | 0.0041 | 498 | 8.7 |
| Nièvre | 2,219 | 198,936 | 0.0112 | 226 | 9.8 |
| Nord | 13,522 | 2,614,334 | 0.0052 | 871 | 15.5 |
| Oise | 4,118 | 830,176 | 0.0050 | 368 | 11.2 |
| Orne | 9,527 | 272,379 | 0.0350 | 330 | 28.9 |
| Paris | 23,534 | 2,087,577 | 0.0113 | 2134 | 11.0 |
| Pas-de-Calais | 8,689 | 1,455,555 | 0.0060 | 615 | 14.1 |
| Puy-de-Dôme | 7,507 | 665,094 | 0.0113 | 622 | 12.1 |
| Pyrénées-Atlantiques | 11,604 | 706,361 | 0.0164 | 938 | 12.4 |
| Pyrénées-Orientales | 21,700 | 497,810 | 0.0436 | 997 | 21.8 |
| Rhône | 19,305 | 1,926,989 | 0.0100 | 1167 | 16.5 |
| Sarthe | 3,640 | 566,096 | 0.0064 | 343 | 10.6 |
| Savoie | 39,590 | 451,819 | 0.0876 | 1,104 | 35.9 |
| Saône-et-Loire | 4,124 | 546,695 | 0.0075 | 523 | 7.9 |
| Seine-et-Marne | 27,943 | 1,464,783 | 0.0191 | 1,120 | 24.9 |
| Seine-Maritime | 17,152 | 1,255,554 | 0.0137 | 728 | 23.6 |
| Seine-Saint-Denis | 4,810 | 1,701,072 | 0.0028 | 367 | 13.1 |
| Somme | 6,982 | 562,126 | 0.0124 | 388 | 18.0 |
| Tarn | 4,512 | 398,772 | 0.0113 | 469 | 9.6 |
| Tarn-et-Garonne | 2,386 | 267,619 | 0.0089 | 258 | 9.2 |
| Territoire de Belfort | 800 | 137,235 | 0.0058 | 66 | 12.1 |
| Val-d’Oise | 7,268 | 1,275,704 | 0.0057 | 381 | 19.1 |
| Val-de-Marne | 6,878 | 1,433,927 | 0.0048 | 498 | 13.8 |
| Var | 40,395 | 1,121,506 | 0.0360 | 1,639 | 24.6 |
| Vaucluse | 16,000 | 568,715 | 0.0281 | 991 | 16.1 |
| Vendée | 8,810 | 717,301 | 0.0123 | 757 | 11.6 |
| Vienne | 5,046 | 440,921 | 0.0114 | 348 | 14.5 |
| Vosges | 3,923 | 355,431 | 0.0110 | 393 | 10.0 |
| Yonne | 7,340 | 328,774 | 0.0223 | 286 | 25.7 |
| Yvelines | 11,805 | 1,473,664 | 0.0080 | 923 | 12.8 |
4 Likes
NO-ooooo! There are already 15 thousand pages of Needs ID plant observations in Massachusetts!
Just kidding, go ahead … your observations are always identifiable, and your legions of followers are always on top of it. Plus, of course, your IDs far outweigh your Observations.
So which of you number crunchers is going to give us the stats on which states/countries have the highest percentages of identifications/identifiers?
3 Likes
As an Arkansan, I’m just happy we overtook Missouri.
2 Likes
Oh, thank you! That’s so kind of you to say! I will say that making IDs taught me how to make my own observations easier to ID. And, really, I just photograph organisms I already know or suspect iNat can ID for me (moths, galls). Oh, wait, even that’s not really true since I started getting into bryophytes in a serious way.
3 Likes
Oh, indeed, I clicked the swap symbol when editing the color gradient - which swaps the colors but not the numbers in the legend… And Salzburg had the third least, since Wien turned into the header column somehow - but with those two things in mind I think the map at least matches the numbers.
1 Like
In case you haven’t seen it, check out the iNat observations map for April 8th 2023 vs 2024.
4 Likes
Isn’t World’s End also in Sullivan? There’s a lot of forest–beautiful county and under appreciated.
Last map for me - Germany with a bit more detailing. It seems to me that my long-held plan to hike the Harzer Wandernadel would possibly have a significant impact on that map so I’m going to set that in motion ![]()
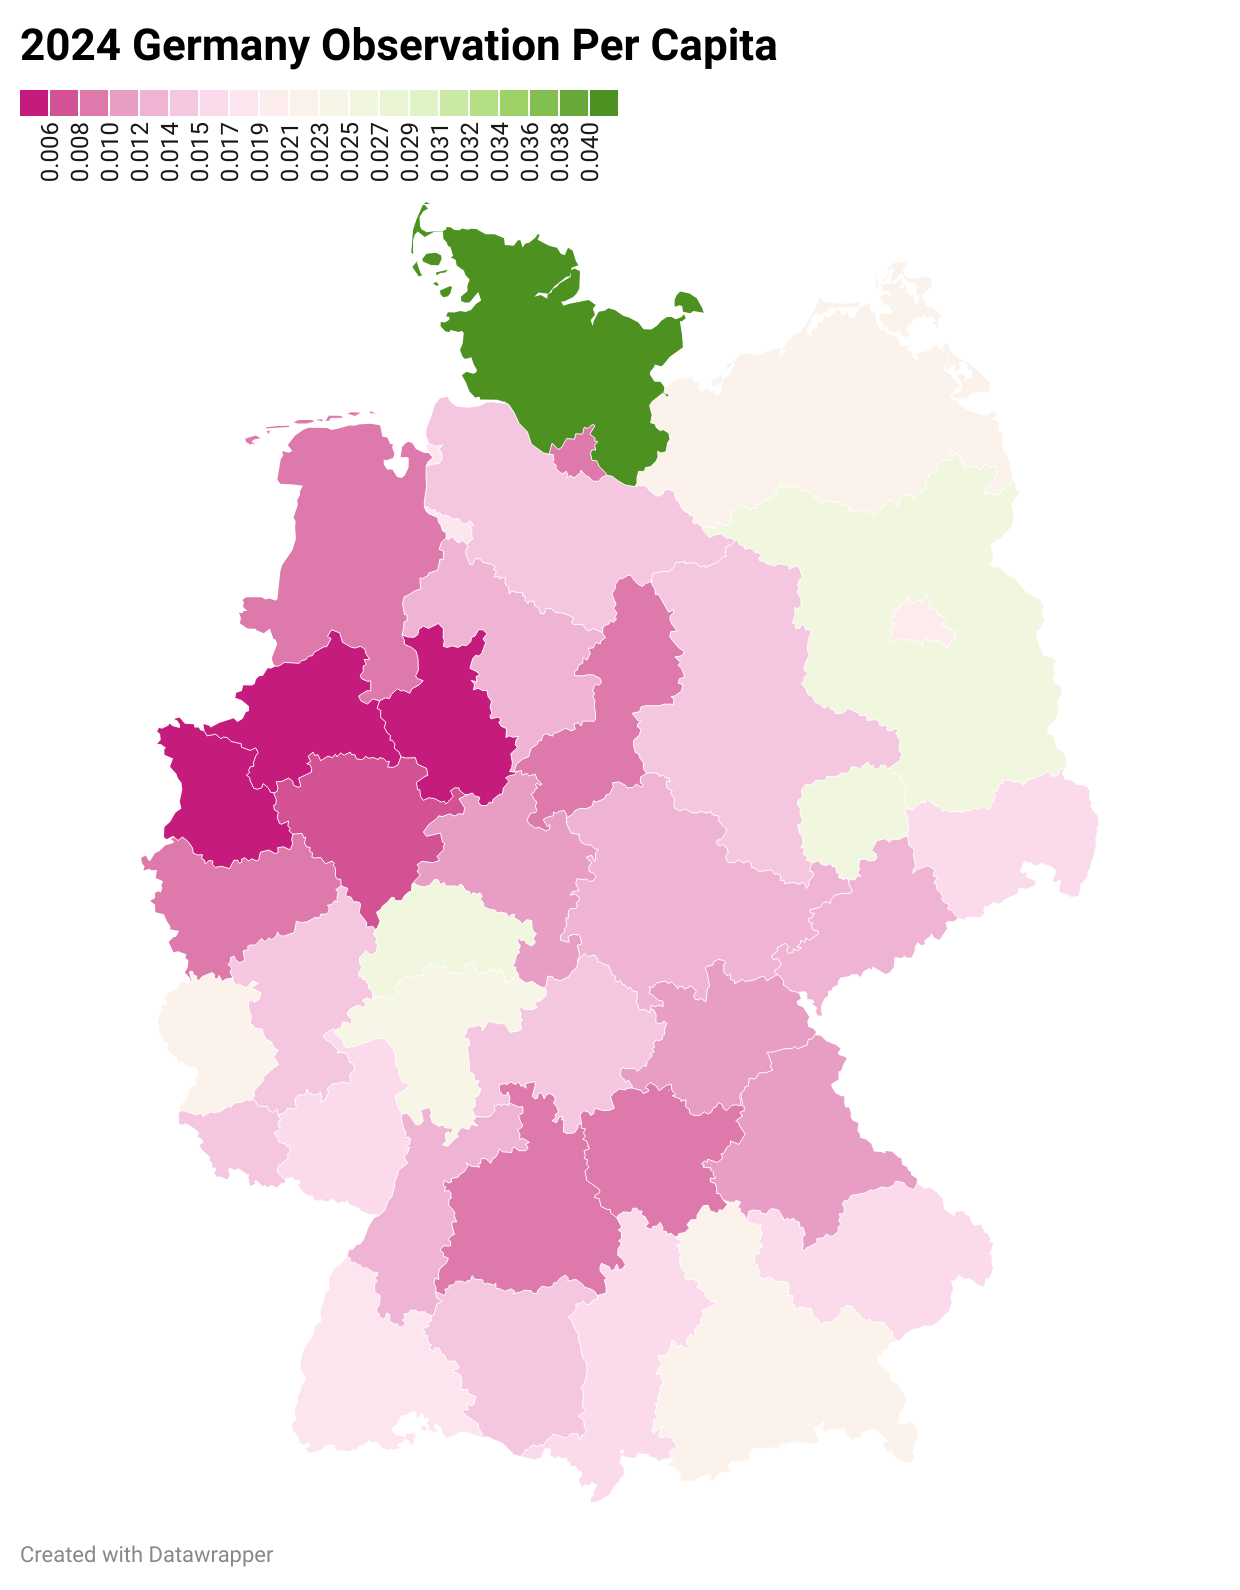
available here: https://www.datawrapper.de/_/zLjVL/
Numbers from all the offices of statistic around the land, I’ve been chasing them all day and didn’t keep the links
Data
| Column 1 | Column 2 | Column 3 | Column 4 |
|---|---|---|---|
| NUTS2 statistic division (Regierungsbezirke or equivalent) | 2024 Verifiable Observations | Population | Observation per Capita |
| Arnsberg | 22,153 | 3,602,426 | 0.0061 |
| Berlin | 74,793 | 3,662,381 | 0.0204 |
| Brandenburg | 66,956 | 2,554,464 | 0.0262 |
| Braunschweig | 15,258 | 1,590,820 | 0.0096 |
| Bremen | 12,592 | 702,655 | 0.0179 |
| Chemnitz | 16,586 | 1,402,923 | 0.0118 |
| Darmstadt | 96,353 | 4,088,107 | 0.0236 |
| Detmold | 8,724 | 2,086,513 | 0.0042 |
| Dresden | 24,652 | 1,595,005 | 0.0155 |
| Düsseldorf | 23,954 | 5,281,469 | 0.0045 |
| Freiburg | 43,378 | 2,337,563 | 0.0186 |
| Gießen | 27,593 | 1,067,354 | 0.0259 |
| Hamburg | 15,097 | 1,851,596 | 0.0082 |
| Hannover | 24,975 | 2,121,989 | 0.0118 |
| Karlsruhe | 36,624 | 2,859,693 | 0.0128 |
| Kassel | 14,081 | 1,235,899 | 0.0114 |
| Koblenz | 22,062 | 1,526,980 | 0.0144 |
| Köln | 44,521 | 4,543,769 | 0.0098 |
| Leipzig | 28,458 | 1,081,978 | 0.0263 |
| Lüneburg | 25,884 | 1,721,218 | 0.0150 |
| Mecklenburg-Vorpommern | 34,577 | 1,578,041 | 0.0219 |
| Mittelfranken | 16,689 | 1,813,946 | 0.0092 |
| Münster | 13,968 | 2,679,622 | 0.0052 |
| Niederbayern | 19,932 | 1,280,685 | 0.0156 |
| Oberbayern | 109,170 | 4,820,938 | 0.0226 |
| Oberfranken | 11,913 | 1,077,349 | 0.0111 |
| Oberpfalz | 12,544 | 1,141,561 | 0.0110 |
| Rheinhessen-Pfalz | 33,993 | 2,097,257 | 0.0162 |
| Saarland | 14,321 | 1,014,047 | 0.0141 |
| Sachsen-Anhalt | 32,514 | 2,144,570 | 0.0152 |
| Schleswig-Holstein | 123,457 | 2,953,202 | 0.0418 |
| Schwaben | 33,509 | 1,962,086 | 0.0171 |
| Stuttgart | 40,232 | 4,226,394 | 0.0095 |
| Thüringen | 25,629 | 2,114,870 | 0.0121 |
| Trier | 12,375 | 548,256 | 0.0226 |
| Tübingen | 26,513 | 1,915,610 | 0.0138 |
| Unterfranken | 18,524 | 1,338,497 | 0.0138 |
| Weser-Ems | 22,357 | 2,469,749 | 0.0091 |
4 Likes
I thought North Carolina might be interesting; I was not disappointed! More observations in the mountains, along the coast, and in tech/urban areas.
Like my Pennsylvania map, this one does all-time verifiable observations:

Here’s the link where you can hover over each county:
https://www.datawrapper.de/_/tHY55/
As a table (listing all states)
| County | Observations | Population | Observations per Capita |
|---|---|---|---|
| Alamance | 46,305 | 181,097 | 0.26 |
| Alexander | 9564 | 36,231 | 0.26 |
| Alleghany | 7,591 | 11,513 | 0.66 |
| Anson | 17,888 | 21,619 | 0.83 |
| Ashe | 28,240 | 26,694 | 1.06 |
| Avery | 50,402 | 17,510 | 2.88 |
| Beaufort | 10977 | 44,003 | 0.25 |
| Bertie | 1735 | 16,856 | 0.10 |
| Bladen | 9,767 | 29,153 | 0.34 |
| Brunswick | 58,533 | 160,440 | 0.36 |
| Buncombe | 253,020 | 277,047 | 0.91 |
| Burke | 26022 | 89,974 | 0.29 |
| Cabarrus | 45,068 | 242,880 | 0.19 |
| Caldwell | 23,026 | 81,960 | 0.28 |
| Camden | 2370 | 10,737 | 0.22 |
| Carteret | 46,335 | 70,268 | 0.66 |
| Caswell | 3810 | 22,461 | 0.17 |
| Catawba | 34,586 | 166,196 | 0.21 |
| Chatham | 89,845 | 81,248 | 1.11 |
| Cherokee | 7,619 | 29,691 | 0.26 |
| Chowan | 2040 | 13,710 | 0.15 |
| Clay | 14,334 | 11,725 | 1.22 |
| Cleveland | 3874 | 100,498 | 0.04 |
| Columbus | 9625 | 50,389 | 0.19 |
| Craven | 14818 | 103,605 | 0.14 |
| Cumberland | 24953 | 337,970 | 0.07 |
| Currituck | 23072 | 31,396 | 0.73 |
| Dare | 94578 | 38,019 | 2.49 |
| Davidson | 21913 | 176,388 | 0.12 |
| Davie | 4619 | 44,249 | 0.10 |
| Duplin | 2006 | 49,178 | 0.04 |
| Durham | 211837 | 337,263 | 0.63 |
| Edgecombe | 2087 | 48,491 | 0.04 |
| Forsyth | 46014 | 393,062 | 0.12 |
| Franklin | 9197 | 77,561 | 0.12 |
| Gaston | 25912 | 240,820 | 0.11 |
| Gates | 5339 | 10,297 | 0.52 |
| Graham | 14389 | 7,985 | 1.80 |
| Granville | 11326 | 62,174 | 0.18 |
| Greene | 693 | 20,153 | 0.03 |
| Guilford | 95,683 | 550,202 | 0.17 |
| Halifax | 4936 | 46,616 | 0.11 |
| Harnett | 17954 | 140,984 | 0.13 |
| Haywood | 70005 | 63,949 | 1.09 |
| Henderson | 48976 | 120,597 | 0.41 |
| Hertford | 1183 | 18,772 | 0.06 |
| Hoke | 6435 | 55,054 | 0.12 |
| Hyde | 15739 | 4,671 | 3.37 |
| Iredell | 20032 | 202,038 | 0.10 |
| Jackson | 56935 | 44,274 | 1.29 |
| Johnston | 21734 | 241,049 | 0.09 |
| Jones | 4536 | 9,208 | 0.49 |
| Lee | 5944 | 67,308 | 0.09 |
| Lenoir | 3266 | 53,966 | 0.06 |
| Lincoln | 4655 | 94,819 | 0.05 |
| McDowell | 15601 | 44,521 | 0.35 |
| Macon | 50588 | 38,152 | 1.33 |
| Madison | 34311 | 21,753 | 1.58 |
| Martin | 2243 | 21,183 | 0.11 |
| Mecklenburg | 132432 | 1,162,168 | 0.11 |
| Mitchell | 14666 | 14,721 | 1.00 |
| Montgomery | 10350 | 25,833 | 0.40 |
| Moore | 22641 | 107,861 | 0.21 |
| Nash | 9268 | 97,802 | 0.09 |
| New Hanover | 92278 | 239,514 | 0.39 |
| Northampton | 963 | 16,503 | 0.06 |
| Onslow | 20633 | 213,447 | 0.10 |
| Orange | 276645 | 150,913 | 1.83 |
| Pamlico | 2075 | 12,521 | 0.17 |
| Pasquotank | 1942 | 41,417 | 0.05 |
| Pender | 21340 | 67,464 | 0.32 |
| Perquimans | 1448 | 13,278 | 0.11 |
| Person | 7508 | 39,461 | 0.19 |
| Pitt | 13998 | 174,842 | 0.08 |
| Polk | 15115 | 19,742 | 0.77 |
| Randolph | 27564 | 146,496 | 0.19 |
| Richmond | 10574 | 42,068 | 0.25 |
| Robeson | 12318 | 116,438 | 0.11 |
| Rockingham | 10077 | 92,416 | 0.11 |
| Rowan | 12932 | 152,450 | 0.08 |
| Rutherford | 15430 | 64,692 | 0.24 |
| Sampson | 2976 | 59,514 | 0.05 |
| Scotland | 14576 | 33,567 | 0.43 |
| Stanly | 10908 | 64,999 | 0.17 |
| Stokes | 14598 | 45,493 | 0.32 |
| Surry | 12717 | 71,774 | 0.18 |
| Swain | 68609 | 13,827 | 4.96 |
| Transylvania | 68281 | 33,193 | 2.06 |
| Tyrrell | 5668 | 3,480 | 1.63 |
| Union | 34664 | 257,682 | 0.13 |
| Vance | 3180 | 41,263 | 0.08 |
| Wake | 460863 | 1,194,900 | 0.39 |
| Warren | 2413 | 18,615 | 0.13 |
| Washington | 3772 | 10,548 | 0.36 |
| Watauga | 80910 | 54,972 | 1.47 |
| Wayne | 6150 | 117,748 | 0.05 |
| Wilkes | 15296 | 65,987 | 0.23 |
| Wilson | 4112 | 78,792 | 0.05 |
| Yadkin | 3029 | 37,722 | 0.08 |
| Yancey | 34246 | 18,524 | 1.85 |
1 Like
Interested in Michigan by counties, I think my state’s top observer is also in my county for the most part, so that would be cool to see. It’s neat, statistics wise, how my state is doing well for Average Observations per Observer, but not so great in Observations per Capita. It reminds me of how data can be used to show a number of different things different ways, and how this property can be manipulated.
4 Likes
So I got curious again, about the average number of ID per identifier, the average number of observations, etc all in Europe, and next I overlaid the participating cities for the City Nature Challenge.
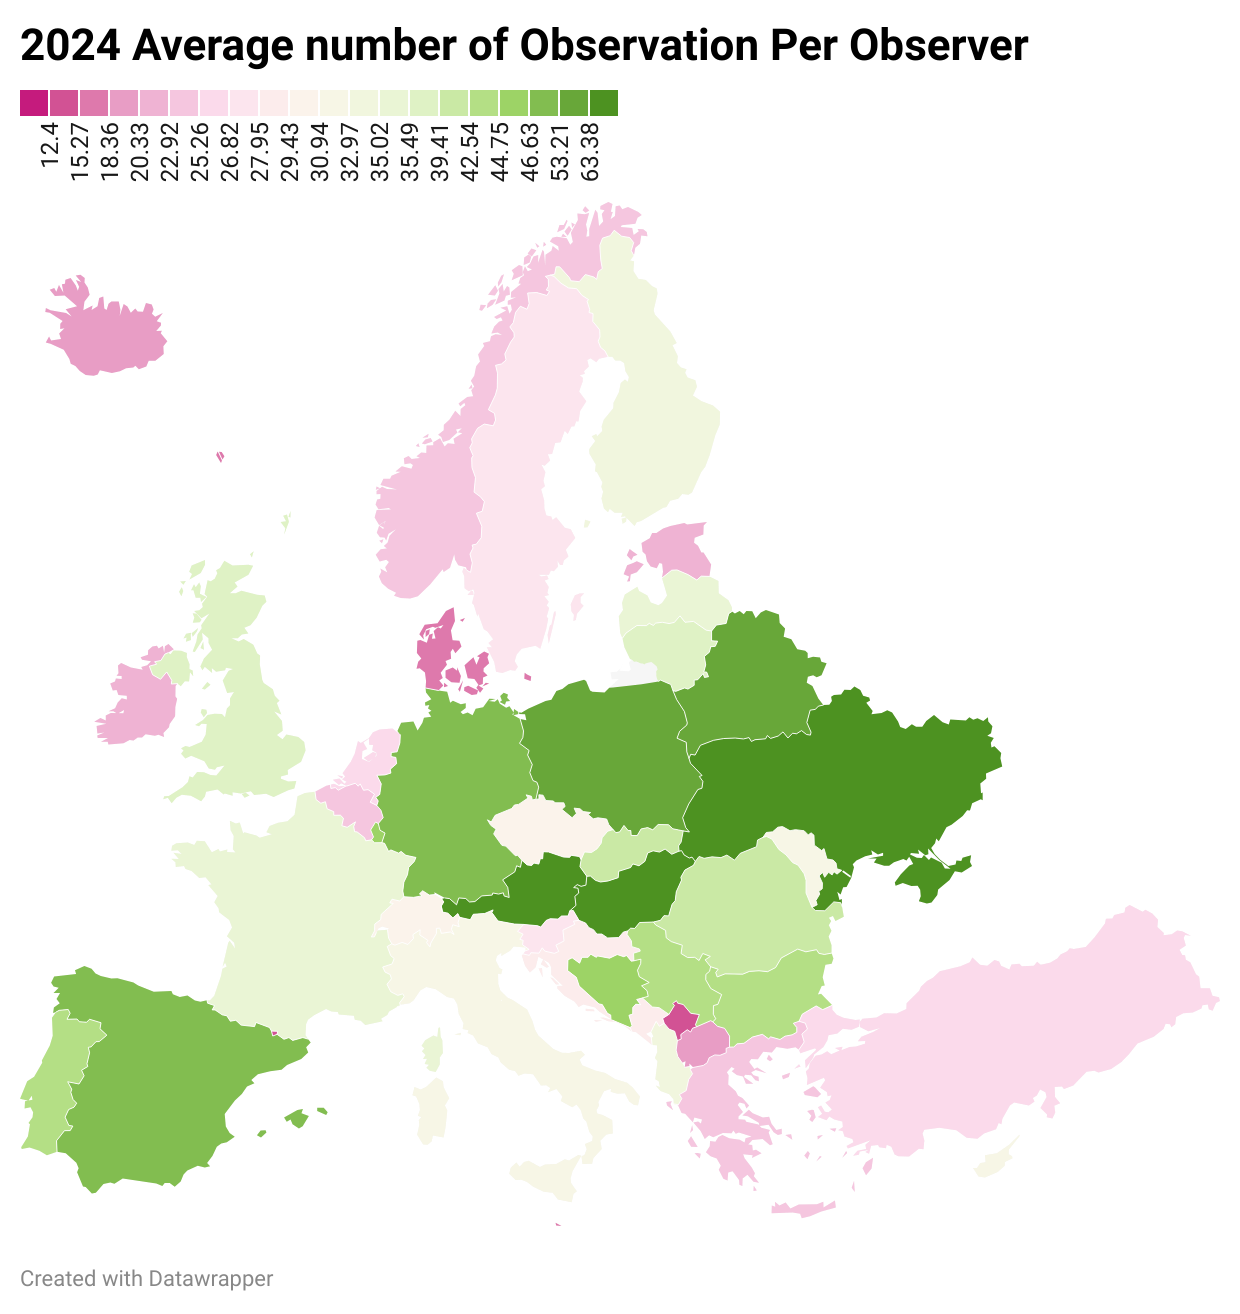
Clickable map: https://www.datawrapper.de/_/mpbbj/

Clickable map: https://www.datawrapper.de/_/Pf7Dp/
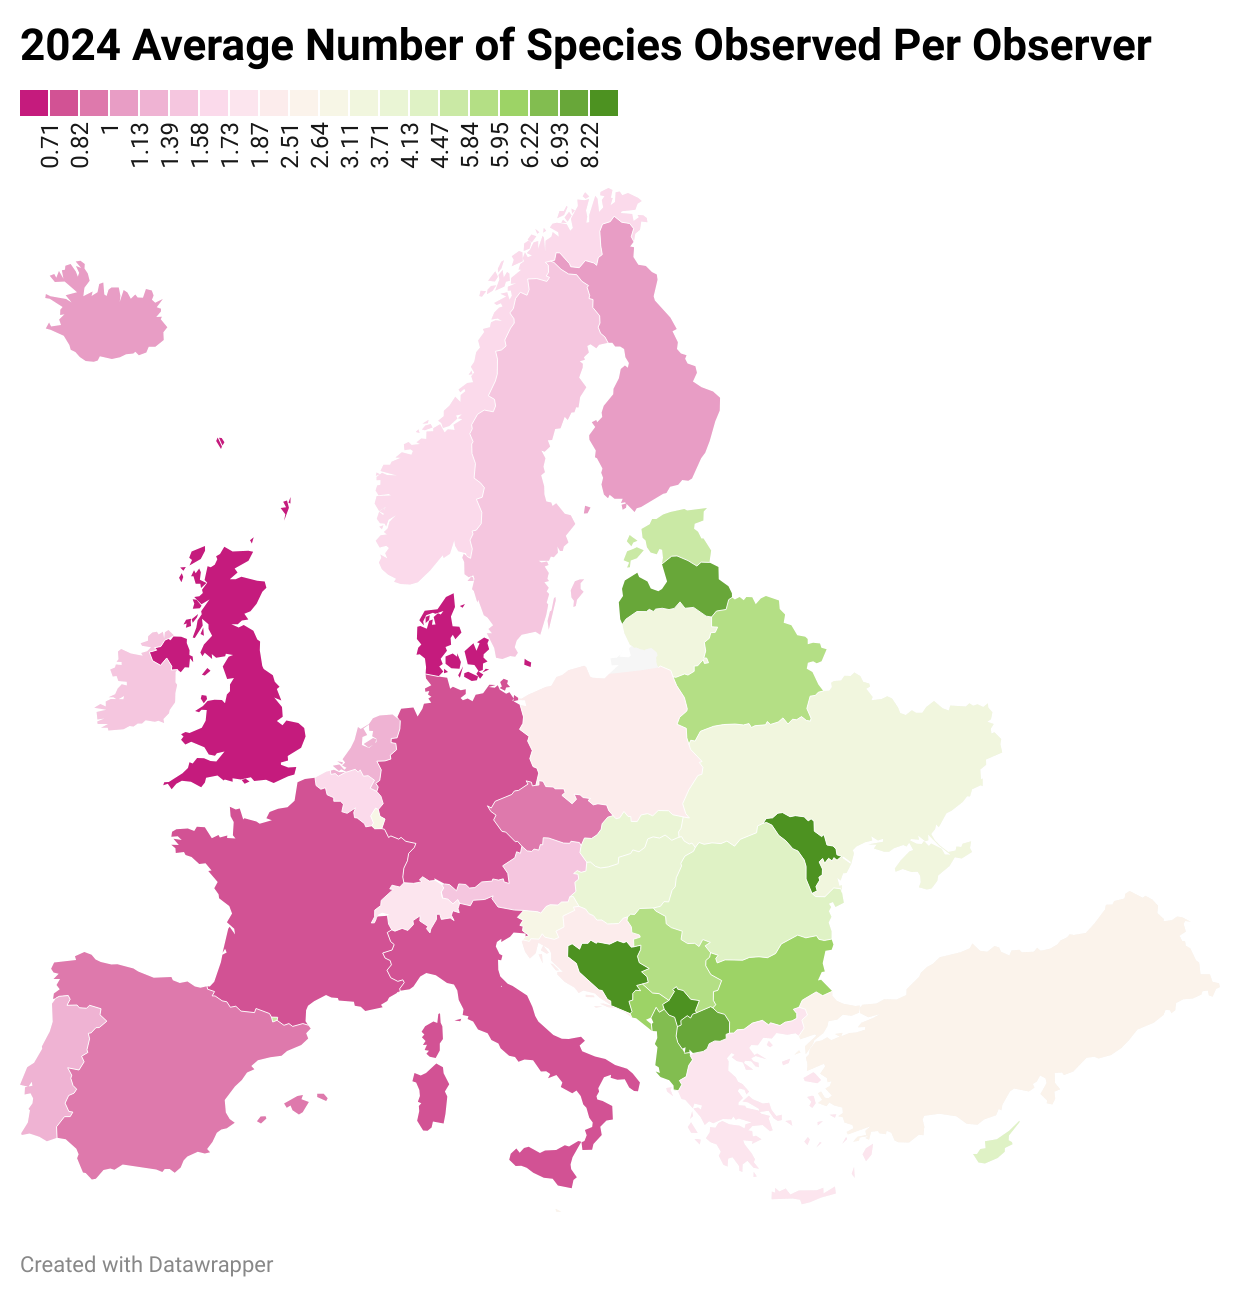
clickable map: https://www.datawrapper.de/_/UhSGu/
Maps + CNC cities

CNC data: https://www.citynaturechallenge.org/past-results
all data
| Column 1 | Column 2 | Column 3 | Column 4 | E | F | G | H | I | J | K |
|---|---|---|---|---|---|---|---|---|---|---|
| Country | 2024 Verifiable Observation | 2024 Population | 2024 Observers | 2024 Identifiers | 2024 Species | Obs. per Capita | Observer percentage in population | 2024 Average Obs By Observer | 2024 Average Number Species Observed | 2024 Average ID by Identifier |
| ALB | 18,668 | 2,761,785 | 557 | 1,448 | 3,780 | 0.0068 | 0.02% | 33.52 | 6.79 | 12.89 |
| AND | 2,258 | 85,101 | 151 | 441 | 879 | 0.0265 | 0.18% | 14.95 | 5.82 | 5.12 |
| AUT | 678,760 | 9,158,750 | 10,702 | 6,520 | 14,834 | 0.0741 | 0.12% | 63.42 | 1.39 | 104.10 |
| BEL | 121,154 | 11,763,650 | 4,822 | 3,660 | 8,304 | 0.0103 | 0.04% | 25.13 | 1.72 | 33.10 |
| BGR | 37,486 | 6,445,481 | 881 | 1,923 | 5,368 | 0.0058 | 0.01% | 42.55 | 6.09 | 19.49 |
| BIH | 12,545 | 3,417,089 | 274 | 904 | 2,483 | 0.0037 | 0.01% | 45.78 | 9.06 | 13.88 |
| BLR | 52,439 | 9,408,350 | 925 | 2,015 | 5,493 | 0.0056 | 0.01% | 56.69 | 5.94 | 26.02 |
| CHE | 191,282 | 8,960,800 | 6,228 | 4,404 | 10,809 | 0.0213 | 0.07% | 30.71 | 1.74 | 43.43 |
| CYP | 19,930 | 933,505 | 607 | 1,309 | 2,600 | 0.0213 | 0.07% | 32.83 | 4.28 | 15.23 |
| CZE | 304,370 | 10,900,555 | 10,335 | 5,006 | 10,043 | 0.0279 | 0.09% | 29.45 | 0.97 | 60.80 |
| DEU | 1,294,886 | 83,445,000 | 26,979 | 10,582 | 19,203 | 0.0155 | 0.03% | 48.00 | 0.71 | 122.37 |
| DNK | 289,101 | 5,961,249 | 15,911 | 4,640 | 9,603 | 0.0485 | 0.27% | 18.17 | 0.60 | 62.31 |
| ESP | 1,164,353 | 48,610,458 | 24,306 | 9,981 | 23,009 | 0.0240 | 0.05% | 47.90 | 0.95 | 116.66 |
| EST | 15,662 | 1,374,687 | 699 | 1,241 | 3,161 | 0.0114 | 0.05% | 22.41 | 4.52 | 12.62 |
| FIN | 286,265 | 5,603,851 | 8,203 | 4,367 | 8,777 | 0.0511 | 0.15% | 34.90 | 1.07 | 65.55 |
| FRA | 1,191,868 | 68,401,997 | 33,699 | 10,434 | 23,768 | 0.0174 | 0.05% | 35.37 | 0.71 | 114.23 |
| GBR | 1,659,877 | 67,025,542 | 44,657 | 11,586 | 15,877 | 0.0248 | 0.07% | 37.17 | 0.36 | 143.27 |
| GRC | 127,918 | 10,397,193 | 5,387 | 3,840 | 9,438 | 0.0123 | 0.05% | 23.75 | 1.75 | 33.31 |
| HRV | 99,978 | 3,861,967 | 3,533 | 3,276 | 8,381 | 0.0259 | 0.09% | 28.30 | 2.37 | 30.52 |
| HUN | 168,450 | 9,548,627 | 2,485 | 3,392 | 10,210 | 0.0176 | 0.03% | 67.79 | 4.11 | 49.66 |
| IRL | 71,672 | 5,343,805 | 3,501 | 2,714 | 5,199 | 0.0134 | 0.07% | 20.47 | 1.49 | 26.41 |
| ISL | 29,100 | 398,940 | 1,471 | 1,471 | 1,504 | 0.0729 | 0.37% | 19.78 | 1.02 | 19.78 |
| ITA | 773,092 | 58,989,749 | 24,800 | 9,066 | 18,117 | 0.0131 | 0.04% | 31.17 | 0.73 | 85.27 |
| KOS | 1,005 | 1,773,971 | 78 | 389 | 657 | 0.0006 | 0.00% | 12.88 | 8.42 | 2.58 |
| LIE | 1,265 | 40,023 | 103 | 340 | 661 | 0.0316 | 0.26% | 12.28 | 6.42 | 3.72 |
| LTU | 71,884 | 2,885,891 | 2,021 | 2,461 | 6,381 | 0.0249 | 0.07% | 35.57 | 3.16 | 29.21 |
| LUX | 79,723 | 672,050 | 1,752 | 2,681 | 5,236 | 0.1186 | 0.26% | 45.50 | 2.99 | 29.74 |
| LVA | 18,262 | 1,871,882 | 519 | 1,416 | 3,846 | 0.0098 | 0.03% | 35.19 | 7.41 | 12.90 |
| MCO | 859 | 38,300 | 129 | 215 | 340 | 0.0224 | 0.34% | 6.66 | 2.64 | 4.00 |
| MDA | 3,249 | 2,423,287 | 105 | 607 | 1,307 | 0.0013 | 0.00% | 30.94 | 12.45 | 5.35 |
| MKD | 4,623 | 1,826,247 | 250 | 659 | 1,758 | 0.0025 | 0.01% | 18.49 | 7.03 | 7.02 |
| MLT | 7,273 | 563,443 | 462 | 814 | 1,176 | 0.0129 | 0.08% | 15.74 | 2.55 | 8.93 |
| MNE | 18,551 | 616,695 | 632 | 1,424 | 3,775 | 0.0301 | 0.10% | 29.35 | 5.97 | 13.03 |
| NLD | 205,901 | 17,942,942 | 7,704 | 4,576 | 9,446 | 0.0115 | 0.04% | 26.73 | 1.23 | 45.00 |
| NOR | 74,575 | 5,550,203 | 3,254 | 2,674 | 5,195 | 0.0134 | 0.06% | 22.92 | 1.60 | 27.89 |
| POL | 370,057 | 36,620,970 | 5,855 | 5,136 | 11,399 | 0.0101 | 0.02% | 63.20 | 1.95 | 72.05 |
| PRT | 489,746 | 10,639,726 | 11,513 | 6,511 | 13,133 | 0.0460 | 0.11% | 42.54 | 1.14 | 75.22 |
| ROU | 68,230 | 19,064,409 | 1,707 | 2,876 | 7,067 | 0.0036 | 0.01% | 39.97 | 4.14 | 23.72 |
| SMR | 538 | 33,812 | 51 | 178 | 298 | 0.0159 | 0.15% | 10.55 | 5.84 | 3.02 |
| SRB | 35,511 | 6,605,168 | 797 | 2,052 | 4,685 | 0.0054 | 0.01% | 44.56 | 5.88 | 17.31 |
| SVK | 69,904 | 5,424,687 | 1,711 | 2,589 | 6,876 | 0.0129 | 0.03% | 40.86 | 4.02 | 27.00 |
| SVN | 53,710 | 2,123,949 | 1,958 | 2,361 | 6,077 | 0.0253 | 0.09% | 27.43 | 3.10 | 22.75 |
| SWE | 153,267 | 10,551,707 | 5,688 | 3,794 | 9,007 | 0.0145 | 0.05% | 26.95 | 1.58 | 40.40 |
| TUR | 86,983 | 85,372,377 | 3,377 | 3,369 | 8,734 | 0.0010 | 0.00% | 25.76 | 2.59 | 25.82 |
| UKR | 302,965 | 40,997,698 | 3,110 | 4,580 | 10,914 | 0.0074 | 0.01% | 97.42 | 3.51 | 66.15 |
5 Likes
Indeed! Pitt County, despite (as I mentioned earlier) appearing well-covered in terms of the number of pins, is near the low end of the scale in observations per capita. I think it is important to note that those three dark green coastal counties are sparsely populated, so it doesn’t take as many total observations to be higher per capita. I’ve a hunch that the same is true of the mountains.
On the other hand, that “island” of green in the middle of the state is the Triangle Area – Raleigh, Durham, Chapel Hill – which is a densly populated urban zone; so we can conclude that interest in iNaturalist is also quite high there. In contrast, North Carolina’s other major city, Charlotte, appears as a medium pink (the county with the little “tab” sticking out into South Carolina).
3 Likes
I’m just not finding the whole ‘slacker’ and I suppose ‘performer’ paradigmn a comfortable fit for how I see iNat, anyhow.
Aside from the fact that we all know that the quantity vs quality is a weak way to measure the scientific with of observations or even biodiversity and demographic distribution of participation, does it recall anything useful about how well citizen science and even deeper, cultural connection with nature exists within states?
To me it comes down to how well does a place’s population demonstrate a respect and connection to the natural world that goes way beyond reserves and parks or participation in measures to protect and support ‘poster’ (usually ‘cute’) species.
How well do they pass on and nurture a positive and understanding of the environments they contain? Who leads that list in the developed world? What can we learn from their efforts to make it work better?
Please pardon my rather clumsy explanation here. I’ve just returned home after a week in hospital with serious pneumonia and my brain is still pretty weak and unfocused. [Oh, bacteria, you sly masters of the living world.]
11 Likes
I hope you recover quickly. ![]()
9 Likes
I 100% agree those are deeper, more important issues than the number of iNaturalist observations per capita!
Still, I think it’s neat to see - an interesting, although (very) imperfect measure of public engagement with iNaturalist and nature in general! ![]()
I definitely wish you a speedy recovery. I for one am pleased that upon your return home, you thought, “Well, I better check the iNaturalist forum!” We definitely have that in common! ![]()
6 Likes
Quantity - which location is observose (I am in observose Cape Town) - is something iNat has blogged about. Where on the world map are the gaps in iNat coverage.
Quality is much harder to evaluate. A mountain of CNC obs, still unidentified, years later?
I imagine a lot of the Yukon observations are by non-residents i,e, tourists. Yukon has a lot of visitors and with its small population the tourist/resident ratio gets really out of wack compared to say Ontario. This would skew the results higher.
I don’t think this is what it appears to be. It says “Verifiable iNat observations for 2024 (divided by) US Census Bureau Population Estimates for 2024” This means that all the photos taken in the state (no matter who takes them) are divided by the state population.
So just because my state is dark green (0.11 to 0.32) does NOT mean that the people in Oregon are taking a lot of pictures and posting them. It could just mean that we have so much natural beauty in my state that people from other states visit to take photos and post them to iNat from here.
In the same way, Nevada (which is less than 0.04) has a lot of desert so lots of people visit Nevada, but maybe not for seeing wildlife. The residents in the state may be posting wildlife photos to iNat but because the population is small (compared to its size) the postings divided by population is not large. The photos that I recently took in the Las Vegas area (once I post them to iNat) will count toward Nevada’s observations, not Oregon’s.
Sorry, I read the beginning of this post, made my comment, and then read all the comments - where I see that others have already commented on these issues. (Always late to the party - sigh.)
Same thought here, biodiversity and abundance, might be interesting factors here, more species, more motivation to ID and log?
1 Like