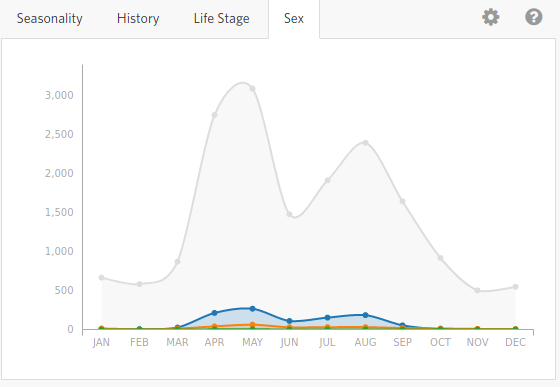
One problem with annotations is that a lot of people don’t fill them out (partially because it is difficult to do, see this request). This means that in most cases, the seasonality charts for any given annotation are dominated by “no annotation”, e.g. this chart of goldfinch sex in the Northeastern US:
As a fairly novice birder, I like to use the seasonality diagrams as a gut check to try and estimate things like the breeding cycle of new birds I’ve encountered (is this a juvenile? is that a female mallard or a male outside of breeding season?), but it’s very difficult when the data is dominated by “no annotation”. It would be nice to have a checkbox for removing the “no annotation” chart.
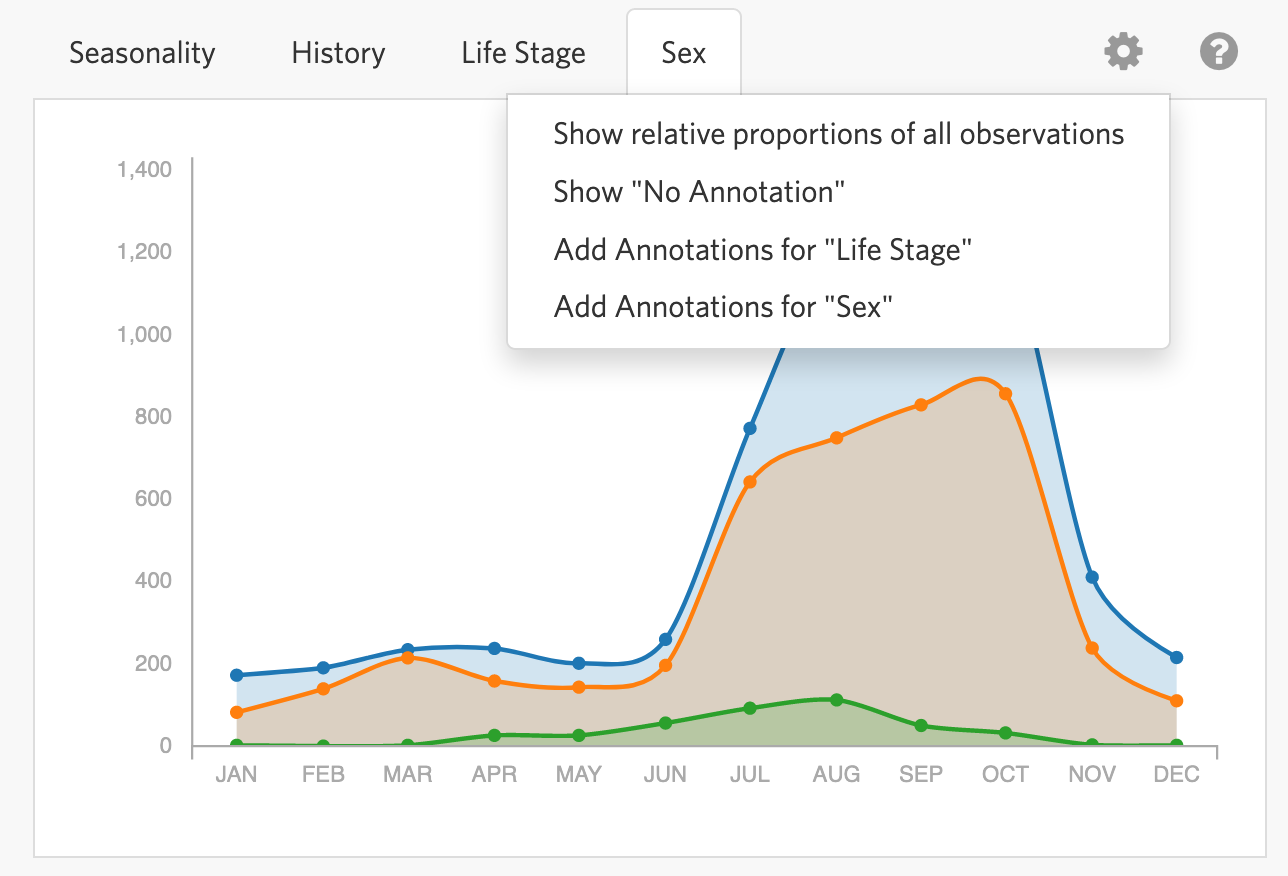
Great idea! Rather than having the option to completely remove the graph showing observations with no annotations, it would be nice to have an option to re-scale it to the maximum shown in the other graphs. For instance, if the curve showing adults has its max at 475 individuals, it would be nice to re-scale the observations with no annotations to that maximum.